Introducing the “Selfnet Network Map”
Our “new” network map is public now which shows the current situation in our (internal) network.
But we also want to describe the path how this project came into existence.
Some years ago several members visited the Gulasch-Programmier-Nacht in Karlsruhe. As a project there they used a Javascript-Library VivaGraphJS, which is a graph rendering engine also used to display molecules, to visualize networks.
Originally the just wanted to know how our network “looks”. The point about the funny movable map that resulted from the rendering engine naturally increased the fun factor.
Some years later another member built a Perl script (because he wantet to learn Perl) to scan our internal network automatically and collect the neighor relations between the devices. This script utilizes SNMP queries to our devices and asks for the LLDP Neighbors.
SNMP (Simple Network Management Protocol) is usually used by us to check for usage informations like temperature, cpu usage or network traffic. But it can (with sufficient privileges) also query a lot more information. This information includes the LLDP (Link Layer Discovery Protocol) data of the device. LLDP is utilizing a lower network layer between configured devices (even before using IP addesses) to exchange basic information between devices. It includes the hostnames or the connected ports. So this can also used to find physical faults in connections.
An example:
Local Interface Parent Interface Chassis Id Port info System Name
ge-0/1/2.0 - xx:xx:xx:xx:xx:xx ge-0/1/0.0
These resulting script data was just used to find missing links or single points of failure (via a script).
The last years we connected those two projects in our network map. The first versions are from 2016 and were used for internal debugging and visualization. Since December 2017 the project is developed in our internal GitLab but only as a “tinkering project” and not as something productive. With the map you could (for example) after bigger network changes or new dormitories check for the network structure and if somewhere fibers are missing or connected in a wrong way.
Meanwhile the project has evolved and several people are using it for debugging or just to understand how our network works.
Thats the reason why we automated it now, “brighten it up” and added several features. Now you can also see the speed of links between devices in colorcode or differentiate hosts by type. The last was quite important as the map became crowded after we added our wireless access points to it.
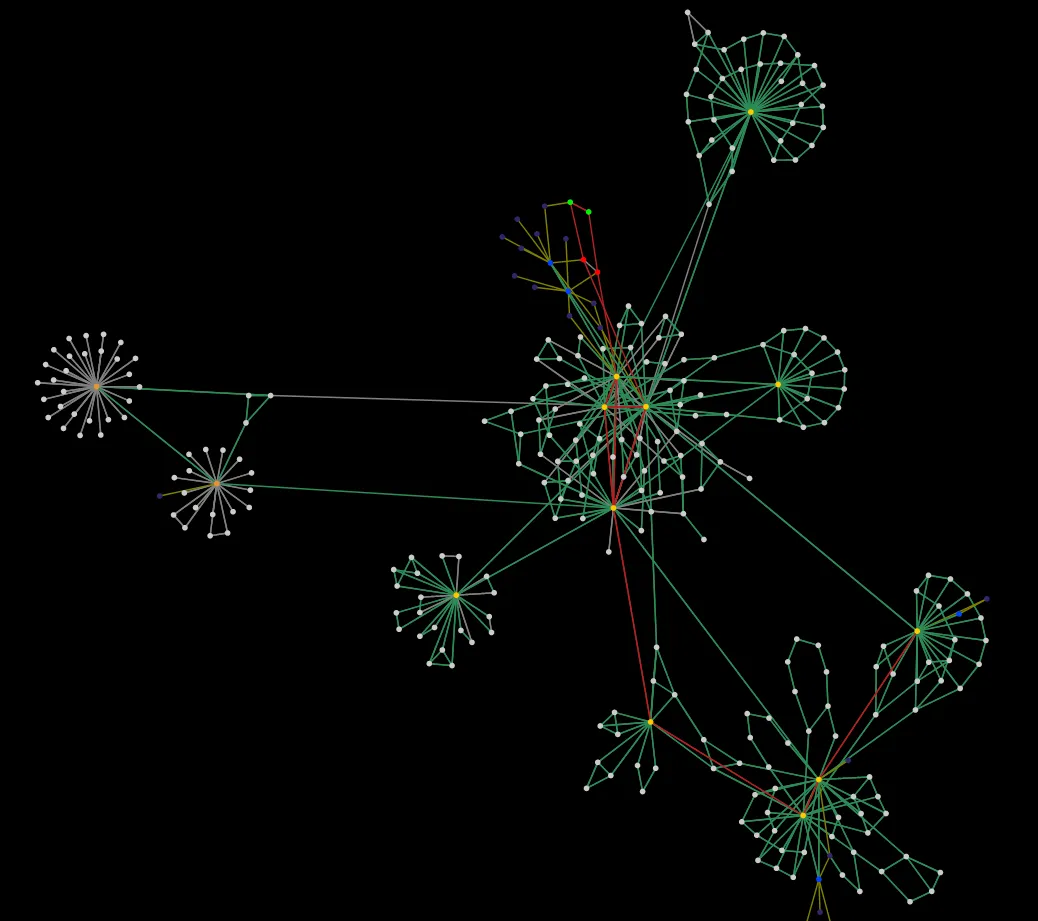
Image: Cutout of the network map
So for transparancy reasons (and so everybody can have a look how our network is connected) we now published the map on our Website. Direct Link
Of course there are still some small bugs we hope to eliminate as soon as possible.
Thanks to all of our members who helped in any way to realize this project.
Do you want to participate in taking care of such problems in the future? For our network to run smoothly there are a lot of different things to do: management of the equipment (including buying new stuff and getting service), taking care of servers for the network or additional services, debugging problems like this or connecting new dormitories to our network.
If you want to volunteer, it doesn’t matter if you are a pro or a starter: Selfnet offers the opportunity to learn everything required. If you are interested in technical stuff, programming, public relations, project management or anything else: We would be glad to welcome you in our team! Just visit our support hours (once the office hours are re-opened).
The Selfnet-Team